
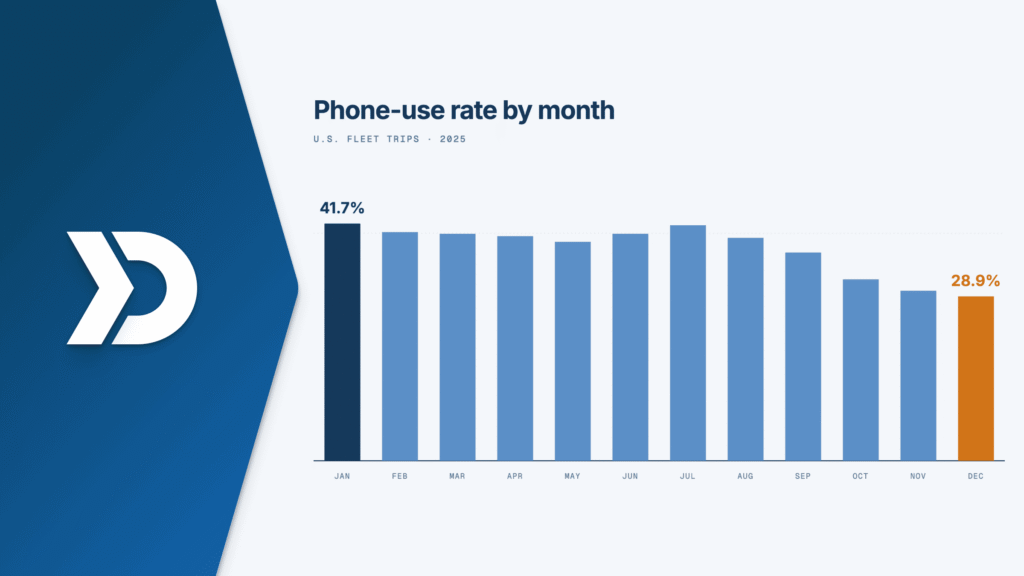
Damoov’s 2025 fleet telematics file covers more than 5.5 million U.S. commercial trips. Phone use while driving follows operational and seasonal patterns — not one uniform habit.
Summer is the sharpest peak — see summer fleet phone-use risk and seasonal distracted driving.
The full U.S. evidence set is in our phone use behind the wheel white paper.
Importantly, the findings show that distracted driving in commercial fleets is not a single uniform behavior. Instead, it changes across:
- driving speeds
- operational periods
- trip types
- seasonal conditions
The data offers a clear large-scale view into how phone interaction occurs during real-world fleet operations.
Table of Contents
- A Rare Look at Real-World Fleet Driver Behavior
- Fleet Phone Use Statistics Show Distraction Is Widespread
- Phone Use While Driving Peaked During Evening Fleet Operations
- Speed and Phone Use Correlation in Commercial Fleet Data
- Phone Use While Speeding Emerged as a Distinct Risk Pattern
- Seasonal Distracted Driving Trends Revealed a Clear Pattern
- Smartphone Telematics Offers a Different View of Distracted Driving
- From Anecdotes to Measurable Fleet Behavior
- FAQ
1. A Rare Look at Real-World Fleet Driver Behavior
Distracted driving is still one of the hardest fleet-safety problems. Phone use gets plenty of debate. Large-scale behavior data from real work trips does not.
Damoov analyzed 5,545,873 U.S. commercial fleet trips from 2025. The file covers 17,346 drivers and nearly 97 million driving minutes, captured on smartphone telematics.
Phone use showed up on more than one-third of trips. Rates moved by time of day. Higher-speed trips were more likely to include phone handling. Phone use plus speeding had its own seasonal spike.
Importantly, this analysis focuses on observation. Instead of prescribing solutions, the data highlights how distracted driving patterns unfold across millions of real-world fleet trips.
That perspective makes the findings particularly relevant for transportation researchers, mobility professionals, insurers, and industry analysts looking for credible commercial fleet distraction data.
2. Fleet Phone Use Statistics Show Distraction Is Widespread
2.1 Phone Use Was Detected on 36.5% of Fleet Trips
The clearest finding from the dataset is also the most striking: phone use was detected on 36.5% of all commercial fleet trips analyzed. In raw numbers, that represents 2,024,122 trips involving measurable handheld phone interaction.
Put differently, approximately one out of every 2.7 work trips included some form of phone handling while driving.
Damoov’s telematics system identified phone interaction using accelerometer and gyroscope data collected through drivers’ mobile devices. Rather than measuring all device-related activity, the system focused specifically on physical phone handling behaviors such as picking up the device, tilting it, or manipulating it manually.
Mounted phones and passive hands-free activity were generally excluded from detection.
2.2 Most Phone Interactions Were Short
The average phone-use episode lasted 1.66 minutes and covered roughly 0.86 miles. However, averages only tell part of the story. The distribution of phone interaction duration was heavily skewed toward shorter events.
Meanwhile, the median interaction lasted just 0.73 minutes, highlighting how frequently fleet distraction events involve quick handling behavior rather than prolonged engagement.
At the same time, the cumulative effect remains significant. Across the full dataset, phone interaction accounted for 3.46% of all driving minutes recorded.
3. Phone Use While Driving Peaked During Evening Fleet Operations
3.1 Evening Rush Hour Produced the Highest Structured Incidence
The data revealed measurable differences in phone-use behavior across the driving day.
Among structured time windows, Evening Rush Hour — defined as 18:00 to 20:00 — produced the highest phone-use incidence rate at 37.6%. By comparison:
- Daytime trips showed a 36.0% incidence rate
- Nighttime trips reached 38.2% raw incidence
Although the difference may appear modest, the consistency of the Evening Rush pattern stands out at scale.
Several operational factors may contribute to this concentration. End-of-shift coordination, dispatch communication, delivery updates, and route adjustments often occur during late-day fleet operations. Consequently, drivers may encounter more workflow-related phone interaction during this period.
3.2 Night Driving Represented a Smaller but Distinct Segment
The nighttime category produced the highest raw incidence overall at 38.2%. However, an important caveat accompanies that figure: nighttime trips represented only 2.1% of the total dataset.
As a result, the nighttime category likely reflects a more specialized subset of commercial driving activity, including:
- long-haul transportation
- overnight delivery
- emergency-service operations
The dataset therefore suggests that elevated nighttime phone-use rates should be interpreted cautiously rather than generalized across all fleet driving.
Another notable detail emerged when comparing interaction intensity rather than simple incidence:
- Evening Rush average episode: 1.42 minutes
- Daytime average episode: 1.78 minutes
- Night average episode: 1.37 minutes
That pattern reinforces the idea that evening phone interaction may often involve short operational check-ins rather than extended engagement.
4. Speed and Phone Use Correlation in Commercial Fleet Data
4.1 Phone-Use Trips Averaged 3.1 MPH Faster
One of the strongest behavioral relationships in the dataset involved trip speed.
Phone-use trips averaged 35.1 mph, compared to 32.0 mph for trips without detected phone interaction. Both mean and median values showed the same consistent +3.1 mph difference.
Importantly, the white paper does not frame this as evidence that drivers intentionally use phones more at higher speeds. Instead, the researchers point toward a likely trip-type effect.
Longer highway trips naturally create more uninterrupted driving time and fewer stop-and-go interruptions. Consequently, these trips may simply provide more opportunity for phone interaction to occur.
4.2 One-Third of Phone-Use Trips Happened Above 40 MPH
The speed distribution data supports that interpretation.
Among all phone-use trips:
- 12.6% occurred below 20 mph
- 27.6% occurred between 20–30 mph
- 26.6% occurred between 30–40 mph
- 23.9% occurred between 40–55 mph
- 9.3% occurred between 55–80 mph
Combined, roughly 33% of all phone-use trips occurred at average speeds above 40 mph.
That finding is operationally significant because the consequences of distraction increase substantially at higher travel speeds. Even short moments of inattention can translate into meaningful travel distance on highways and arterial roads.
The dataset therefore highlights an important nuance in distracted driving commercial fleet data: phone interaction does not disappear at higher speeds. Instead, it remains present across a broad range of driving environments.
5. Phone Use While Speeding Emerged as a Distinct Risk Pattern
5.1 One in Ten Phone-Use Trips Also Included Speeding
While overall phone-use prevalence was substantial, the most distinctive behavioral signal in the dataset involved the overlap between phone use and speeding.
Damoov identified 206,943 trips where both behaviors occurred simultaneously. That represents:
- 3.7% of all trips
- 10.2% of all phone-use trips
In other words, approximately one in every ten phone-use trips also involved speeding behavior.
5.2 Combined Events Were Brief — but Operationally Significant
The average overlap episode lasted only around 18 seconds. However, even that relatively short duration covered roughly 0.3 miles on average.
This combination created what the white paper described as the “highest-risk behavioral state” observed in the dataset.
Importantly, the overlap between speeding and phone use did not remain constant throughout the year.
July and August produced the highest combined phone+speeding rate at 5.0%, which was 61–85% higher than the Q1 baseline of 2.9–3.1%.
Researchers also found that summer phone+speeding trips were not significantly different in terms of:
- trip distance
- average speed
- interaction duration
Instead, the elevated summer signal reflected a higher frequency of these combined events occurring across the fleet population.
6. Seasonal Distracted Driving Trends Revealed a Clear Pattern
6.1 Q1 Produced the Highest Fleet Phone Use Rates
Beyond the summer compound-risk spike, the full dataset showed a pronounced seasonal arc in overall phone-use behavior.
January recorded the highest phone-use rate of the year at 41.7%. Q1 overall remained consistently elevated:
- February: 40.2%
- March: 39.9%
Phone-use prevalence then gradually declined through spring before stabilizing during summer months.
6.2 Q4 Became the Year’s Lowest-Distraction Period
By contrast, Q4 represented the clearest low point in the annual cycle:
- October: 31.9%
- November: 29.9%
- December: 28.9%
The nearly 10-percentage-point difference between Q1 highs and Q4 lows created a strong trend in the study. However, the researchers also noted an important methodological consideration.
The composition of the driver pool changed substantially throughout the year. Q1 included a smaller but highly active driver population, while later months introduced larger numbers of less-active drivers.
As a result, seasonal comparisons likely reflect both behavioral shifts and changes in fleet composition.
7. Smartphone Telematics Offers a Different View of Distracted Driving
7.1 Traditional Measurement Methods Have Clear Limitations
Much of the existing conversation around distracted driving relies on:
- surveys
- crash reports
- roadside observation studies
Each method provides useful insights, but they also introduce limitations.
Drivers may underreport distraction behavior in surveys. Meanwhile, roadside observation captures only brief moments rather than continuous trip behavior.
7.2 Telematics Enables Continuous Behavioral Observation
Smartphone telematics offers a fundamentally different measurement approach.
By continuously recording motion, speed, and handling patterns throughout real-world trips, telematics platforms can observe distracted driving behavior at operational scale.
That capability becomes especially important in commercial transportation environments, where employer-managed mobile applications make large-scale behavioral analysis feasible across millions of trips.
The result is a more detailed picture of how phone interaction actually occurs during everyday fleet operations — not just when crashes happen or when drivers self-report their behavior.
8. From Anecdotes to Measurable Fleet Behavior
The Damoov analysis provides one of the largest publicly discussed datasets on commercial fleet distracted driving behavior to date.
Across 5.5 million trips, the findings revealed consistent patterns:
- 36.5% overall phone-use prevalence
- elevated Evening Rush Hour incidence
- a +3.1 mph speed association
- strong seasonal variation
- a pronounced summer phone+speeding signal
Most importantly, the data shows that distracted driving in commercial fleets is not a single uniform behavior. Instead, it changes across:
- time periods
- trip types
- driving speeds
- seasonal conditions
For transportation professionals, insurers, mobility researchers, and safety analysts, that level of behavioral visibility offers a more nuanced understanding of real-world commercial driving patterns in 2025.
FAQ: Distracted Driving in Commercial Fleets
1. How common is phone use in commercial fleet driving?
According to Damoov’s 2025 telematics analysis, phone interaction was detected on 36.5% of all commercial fleet trips analyzed across more than 5.5 million U.S. trips.
2. What qualifies as “phone use” in the dataset?
The telematics system measured physical phone handling behaviors using smartphone accelerometer and gyroscope data. Mounted phones and passive hands-free activity were generally excluded from detection.
3. What time of day showed the highest phone-use rates?
Evening Rush Hour (18:00–20:00) produced the highest structured phone-use incidence rate at 37.6%.
4. Did drivers use phones more at higher speeds?
Phone-use trips averaged 35.1 mph compared to 32.0 mph for non-phone trips. Roughly one-third of phone-use trips occurred at average speeds above 40 mph.
5. How often did phone use overlap with speeding?
The study found that:
- 3.7% of all trips involved both phone use and speeding
- 10.2% of phone-use trips also included speeding behavior
This overlap represented the highest-risk behavioral state observed in the dataset.
6. Which months showed the highest distracted driving rates?
January recorded the highest overall phone-use rate at 41.7%. However, July and August produced the strongest phone+speeding overlap signal at 5.0%.
7. Why is smartphone telematics useful for distracted driving research?
Unlike surveys or roadside observations, smartphone telematics enables continuous behavioral measurement across millions of real-world trips. That allows researchers and fleet operators to analyze driving behavior at operational scale.
8. Does the data represent all drivers?
No. The dataset specifically reflects commercial fleet drivers operating work-related trips in the United States during 2025. The findings should therefore be interpreted within the context of fleet operations rather than the general driving population.