Driver Safety

Safety Score

Score every driver on real-world risk factors, spotlight safe driving habits, and flag dangerous behavior — all powered by smartphone telematics, no hardware required. Measure and Improve Driver Safety — Directly from Your Mobile App

Key Features

Everything you need to understand, score, and improve driver safety.

Driver Safety Score

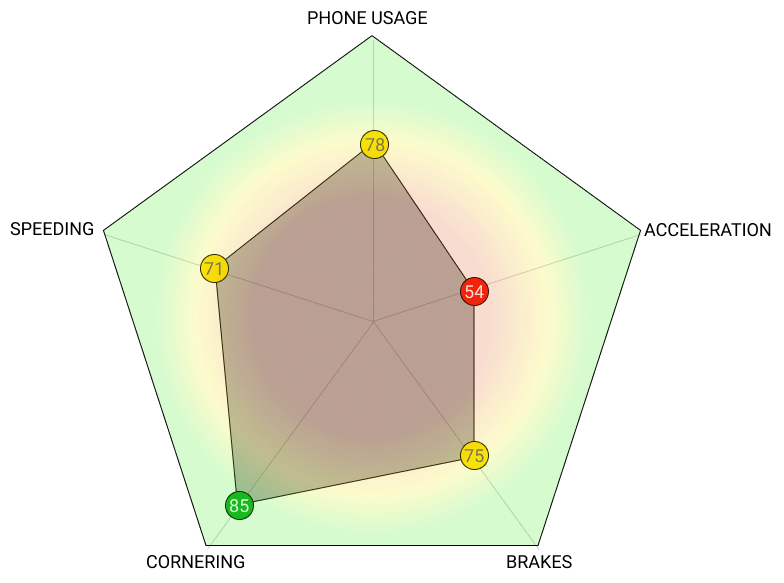
A single, transparent score that quantifies each driver’s risk profile based on real driving data.

Risk Event Detection

Automatic identification of harsh braking, rapid acceleration, aggressive cornering, speeding, and phone use — as they happen.

Coaching Insights

Targeted, driver-specific recommendations that turn risky habits into safer behavior over time.

Fleet Safety

Aggregate dashboards and benchmarks to monitor safety trends, compare drivers, and track improvement across your fleet.

Configurable Scoring Model

Choose the risk factors that matter most for your fleet, region, and use case.

Scoring model factors

Common factors

Additional factors

From Raw Trips to Risk Insights

Segment your drivers by behavior, benchmark against your fleet, and act on clear risk signals.
According to telematics industry data, drivers classified as low-risk experience up to 5× fewer accidents than average — a gap that holds even among younger age groups.

Driving Behavior Patterns

Safe Driver
  • Minimal phone use while driving
  • Very few risk events per trip
  • Consistent compliance with posted speed limits
Moderate Driver
  • Occasional speeding (typically <10% over posted limits)
  • Infrequent harsh braking or cornering events
  • Low distraction rate
Risky Driver
  • Frequent speeding, including in adverse weather
  • High rates of phone distraction
  • Aggressive acceleration, braking, and cornering
  • Elevated exposure (high mileage, frequent night driving)

Driving Behavior and Accident Risk

Driving behavior is the strongest predictor of accident frequency and claims cost. With continuous measurement and targeted coaching, organizations can reduce risk over time.
For insurers, this enables usage-based insurance (UBI) programs grounded in real driving data. For fleet operators and driving schools, it powers data-driven coaching that demonstrably reduces incident rates.

Flexible Observation Windows

A reliable driver risk profile typically emerges within 30 days of monitoring. For annual mileage estimation and long-term trend analysis, we recommend a minimum of 3 months. The platform supports continuous monitoring to keep risk scores current as driving patterns evolve.

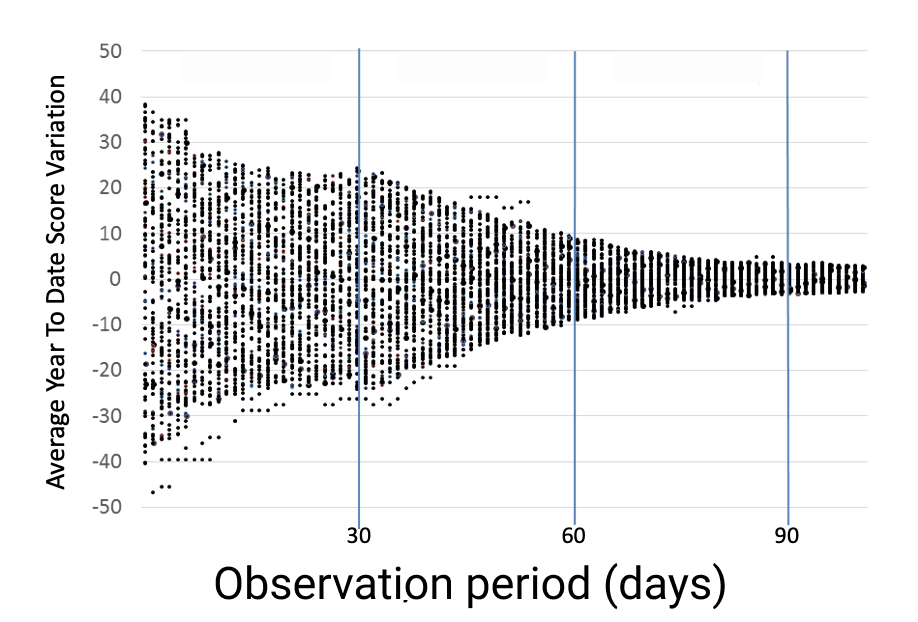
A one-month observation period is typically enough to collect sufficient driving data and reach stable driver risk assessment results.

Telematics solutions use different monitoring windows – from 30 days to continuous driver monitoring. Our analysis shows that in about 1 month, you can reliably identify a driver’s driving style, even if they temporarily try to adjust behavior during the measurement period.

For more accurate annual mileage estimation, the scoring model usually stabilizes in 3-4 months. Since driving behavior changes over time due to lifestyle, location, or work shifts, we recommend keeping telematics monitoring active periodically to maintain an up-to-date driver risk score.

For most use cases, 3 months of monitoring is sufficient to achieve consistent, steady driving risk scoring.

Driver Scorecards

Safety Score detects and classifies key risk events using smartphone sensor data and posted speed-limit information.

Speeding

Continuously compares the driver’s actual speed against posted speed limits. Speeding events are grouped by duration and severity, giving you a clear picture of how often and how significantly each driver exceeds the limit.

Distracted Driving

Identifies phone usage while driving using a proprietary detection model. Distraction events are classified by duration to distinguish a brief glance from sustained, dangerous phone interaction.

Cornering

Detects aggressive cornering using calibrated lateral acceleration data from the smartphone. Events are classified by severity to distinguish normal turns from high-risk maneuvers.

Acceleration

Flags rapid acceleration events using calibrated longitudinal sensor data. Severity levels help differentiate assertive merging from dangerous, aggressive driving.

Braking

Detects harsh braking using calibrated deceleration data. Events are scored by intensity to separate normal stops from emergency or aggressive braking.

Why Mobile Telematics?

Scale Globally Without Hardware

No devices to ship, no SIM cards to manage, no import logistics to navigate. Mobile telematics turns any smartphone into a powerful sensor — ready to collect high-quality driving data from day one, anywhere in the world.

Up to 70% Lower Cost Than OBD

Eliminate device procurement, installation, cellular plans, and ongoing hardware maintenance. Mobile telematics is a pure software model — no physical inventory, no replacement cycles, and dramatically lower total cost of ownership compared to on-board diagnostics (OBD) or GPS trackers.

Configure and Update in Hours

Forget firmware rollouts and device recalls. With mobile telematics, configuration changes and model updates go live in hours, not months — across your entire user base. And because modern smartphones pack powerful processors and advanced sensor arrays, you can run sophisticated algorithms on-device that no dedicated hardware tracker can match.

Connects to the Systems You Use Now

Stream telematics data into your fleet management, insurance, or mobility platform through well-documented APIs. No middleware, no custom connectors — just clean integration that fits your existing technology stack.

Get Started

Tell us about your use case and we will recommend the right integration path for your team.

By submitting this form, you agree to our Privacy Policy and Terms of Service.

Solutions Across Mobility Industries

Purpose-built telematics capabilities for fleet, insurance, mobility, and education verticals.

🚛

Fleet Management

Real-time location monitoring, driver safety scoring, and fleet-wide performance analytics.

📦

Logistics & Delivery

Trip logging, driver behavior monitoring, and real-time speed and location tracking for every delivery.

🚕

Mobility Platforms

Driver performance metrics, trip-level behavior analysis, and live location tracking for ride and mobility services.

🛡️

Insurance

Driving behavior data for usage-based insurance, risk scoring, and claims evidence.

🎓

Driving Schools

Student driving behavior assessment, lesson-by-lesson safety scoring, and progress tracking.

🚌

School Transport

Real-time vehicle tracking, driver safety monitoring, and trip visibility for parents and administrators.

🔑

Carsharing & Rentals

Vehicle location tracking, trip logs, and driver behavior monitoring for shared and rental fleets.

Frequently Asked Questions

A safety score is a numerical rating (typically 0–100) calculated from driving behavior data including acceleration, braking, cornering, speeding, and phone usage. Each trip gets an individual score, and cumulative scores track driver improvement over time.
The Damoov safety scoring algorithm analyzes over 100 behavioral parameters per trip, including harsh events, speed patterns, phone distraction, time-of-day risk factors, and road-type context.
Yes. Safety scores are designed for usage-based insurance programs. Insurers use per-trip and cumulative scores for dynamic pricing, renewal adjustments, and policyholder engagement.
The SDK analyzes smartphone handling patterns during driving — screen orientation changes, tap interactions, and sensor micro-movements indicating the phone is being held or manipulated. Detection runs on-device to preserve privacy and flags distraction events per trip.
Yes. Scoring weights for acceleration, braking, cornering, speeding, and distraction can be configured per program — enabling distinct models for teen drivers, fleet professionals, UBI pricing, and defensive-driving coaching.

Ready to Reduce Driver Risk?

Talk to our team about integrating Safety Score into your platform.