Speed, timing, and seasonal patterns from 5,545,873 trips recorded across the United States in 2025. Analysis of distracted driving patterns across 17,346 commercial fleet drivers.
5.5M
Trips Analyzed
17,346
Unique Drivers
2026
Published
US
Primary Region
CHAPTER 01
One in three fleet trips involved handheld phone use.
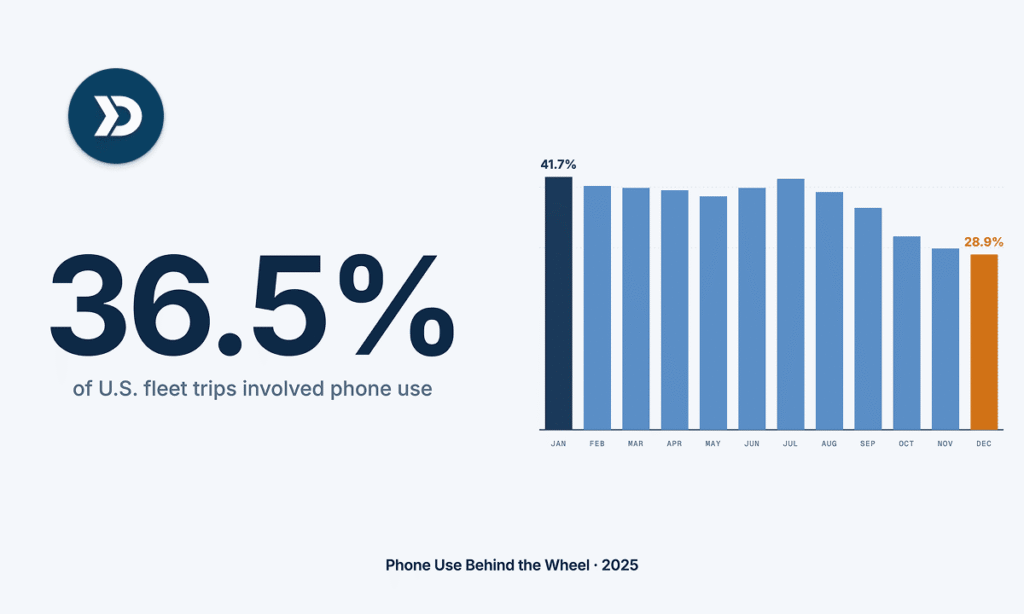
Phone use was detected on 36.5% of all trips — 2,024,122 episodes in total. Most were brief (median 0.73 minutes), but they accumulated to 3.46% of all driving time.
CHAPTER 02
Phone-use trips run consistently faster.
A +3.1 mph gap holds in both mean and median speeds — likely a trip-type composition effect, since longer highway journeys give more opportunity for interaction. Operationally, the consequences scale with speed.
All trips
32.0mph
Phone-use trips
35.1mph
+3.1 mph in both mean and median
CHAPTER 03
Summer hides the sharpest risk signal.
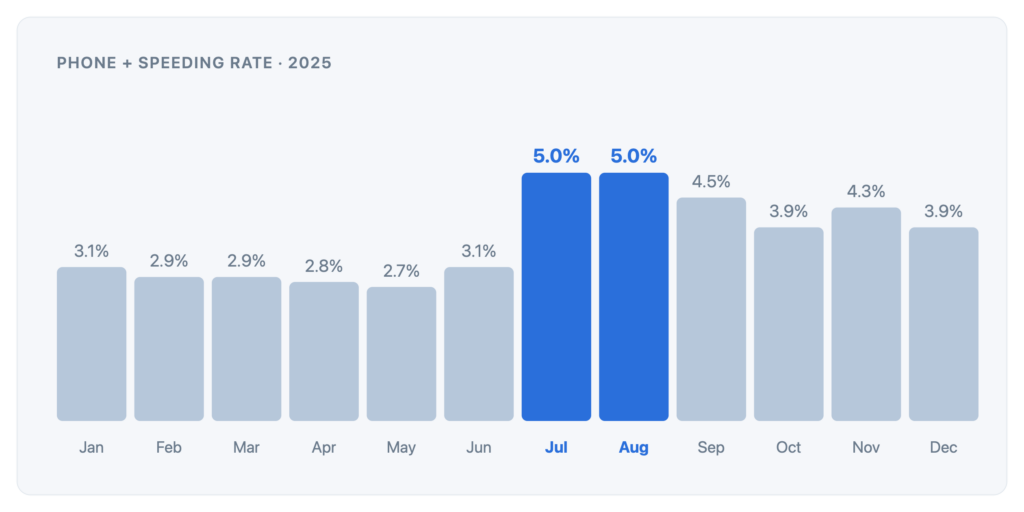
The phone+speeding combination jumps to 5.0% in July and August — 61–85% above the Q1 baseline of 2.9–3.1% — even though overall phone-use incidence is not exceptional during those months.
The phone+speeding signal is the cleaner indicator of elevated summer risk.
CHAPTER 04
Three priorities for fleet operators.
01
Evening-hour coaching
Focus end-of-shift communication policy on the 18:00–20:00 window where incidence peaks.
02
Summer campaigns
Prioritize phone+speeding interventions in July and August, when compound risk is 61–85% above baseline.
03
Sensor-tuned alerting
Calibrate telematics alerts to handheld interaction detection — not all phone activity.
Read the full paper.
17 pages — methodology, every finding, references, and the underlying summary statistics.